
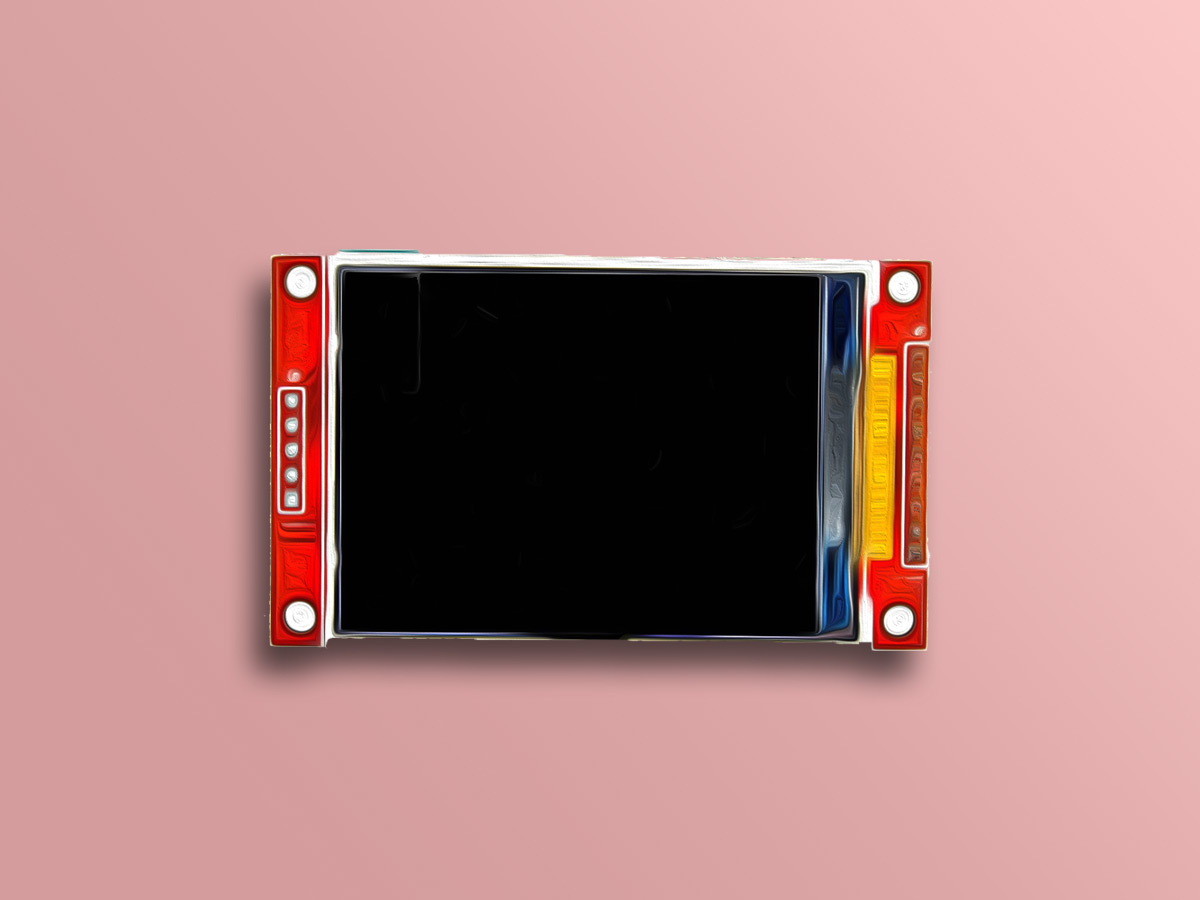
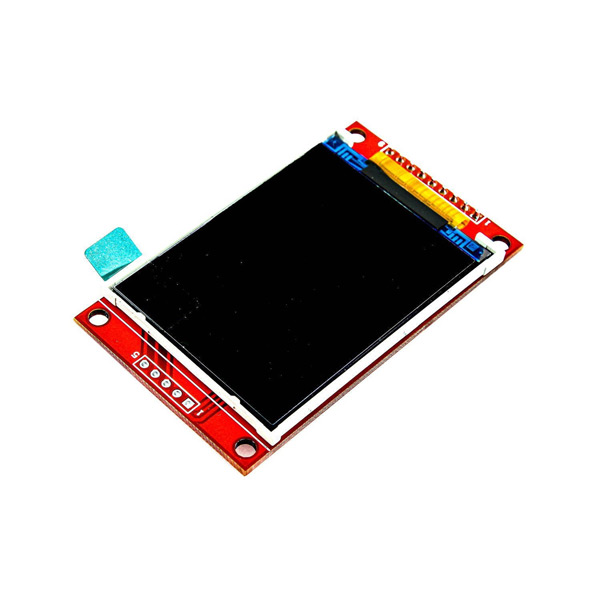
2.2 INCH Full Color TFT Display Features
The TFT display is a kind of liquid crystal display that is connected to each pixel using a transistor and it features low current consumption and backlight. This 2.2-inch full color LCD has a narrow PCB screen. The resolution is 320×280 pixels and it has a four-wire SPI interface and white backlight.
This display also has a touch screen and SD card slot.
Note
The module voltage is 3.3 V and a voltage divider is required to interface it with Arduino.
To download datasheet and for more details, refer to link below.
http://www.lcdwiki.com/2.2inch_SPI_Module_ILI9341_SKU:MSP2202
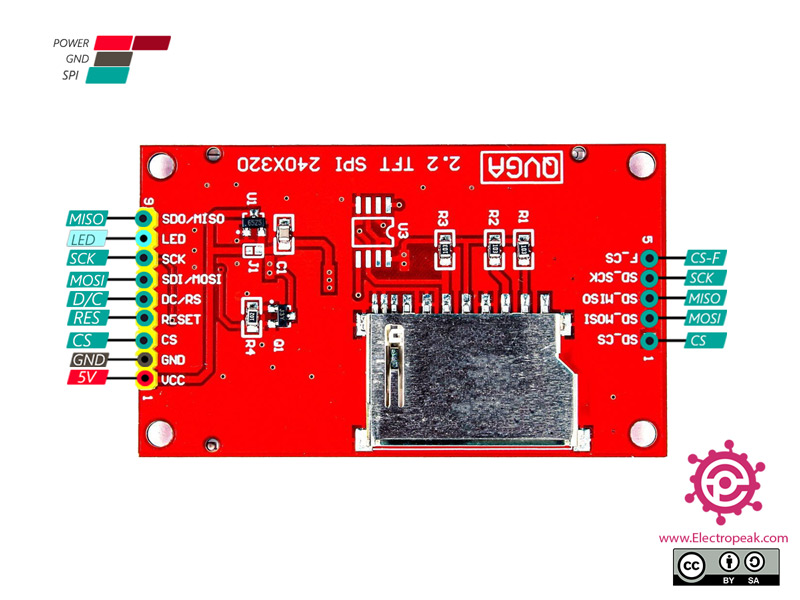
2.2 inch Full Color TFT Display Pinout
This module has 14 pins:
- VIN: Module power supply – 3.3 – 5V
- GND: Ground
- RST: LCD reset
- CS: LCD chip select signal, for SPI protocol
- D/C: Data selection signal
- MOSI: SPI bus write data signal
- MISO: SPI bus read data signal
- SCK: SPI bus clock signal
- LED: Backlight control
- SD-MOSI: SPI bus write data signal
- SD-MISO: SPI bus read data signal
- SD-SCK: SPI bus clock signal
- SD-CS: Chip select signal for SPI protocol (SD Card)
- F-CS: Chip select signal for SPI protocol (SPI FLASH)
You can see the pinout of this module in the image below.
Required Materials
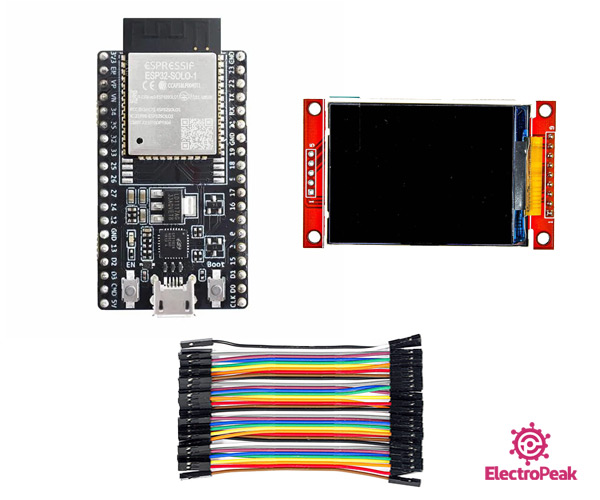
Hardware Components
Software Apps
Interfacing 2.2 inch Full Color TFT Display with ESP32
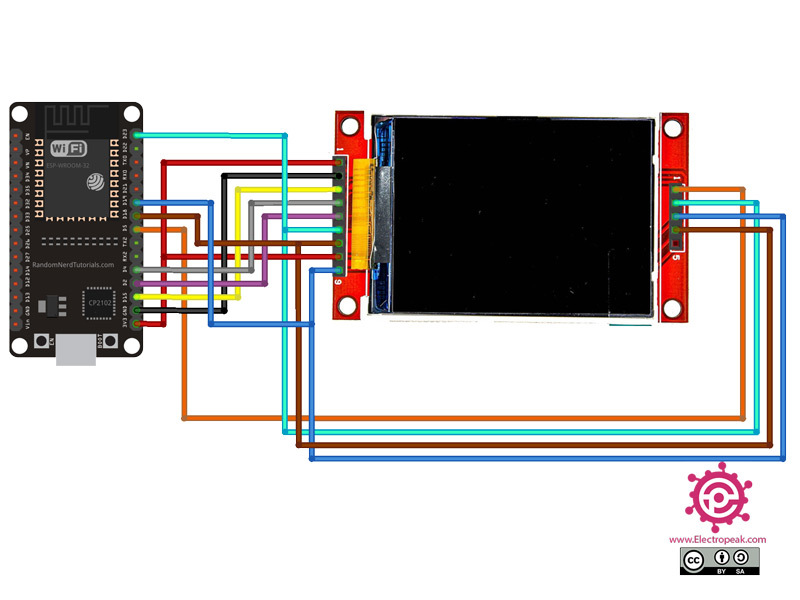
Step 1: Circuit
The following circuit shows how you should connect ESP32 to this Display. Connect wires accordingly.
Step 2: Library
First, install the following library on Arduino IDE.
https://github.com/Bodmer/TFT_eSPI
After that, refer to the address of installed library and open the User_Setup.h file and refer to line
EDIT THE PIN NUMBERS IN THE LINES FOLLOWING TO SUIT YOUR ESP32 SETUP
and uncomment the following lines and comment the lines which are not commented.
#define TFT_MISO 19
#define TFT_MOSI 23
#define TFT_SCLK 18
#define TFT_CS 15 // Chip select control pin
#define TFT_DC 2 // Data Command control pin
#define TFT_RST 4 // Reset pin (could connect to RST pin)
Download the ready file from link below and use in your project.
Tip
If you need more help with installing a library on Arduino, read this tutorial: How to Install an Arduino Library
Step 3: Code
Upload the following code to your ESP32.
   /*
  Example animated analogue meters using a ILI9341 TFT LCD screen

  Needs Font 2 (also Font 4 if using large scale label)

  Make sure all the display driver and pin comnenctions are correct by
  editting the User_Setup.h file in the TFT_eSPI library folder.

  #########################################################################
  ###### DON'T FORGET TO UPDATE THE User_Setup.h FILE IN THE LIBRARY ######
  #########################################################################
*/

#include <TFT_eSPI.h> // Hardware-specific library
#include <SPI.h>

TFT_eSPI tft = TFT_eSPI();       // Invoke custom library

#define TFT_GREY 0x5AEB

#define LOOP_PERIOD 35 // Display updates every 35 ms

float ltx = 0;    // Saved x coord of bottom of needle
uint16_t osx = 120, osy = 120; // Saved x & y coords
uint32_t updateTime = 0;       // time for next update

int old_analog =  -999; // Value last displayed
int old_digital = -999; // Value last displayed

int value[6] = {0, 0, 0, 0, 0, 0};
int old_value[6] = { -1, -1, -1, -1, -1, -1};
int d = 0;

void setup(void) {
  tft.init();
  tft.setRotation(0);
  Serial.begin(57600); // For debug
  tft.fillScreen(TFT_BLACK);

  analogMeter(); // Draw analogue meter

  // Draw 6 linear meters
  byte d = 40;
  plotLinear("A0", 0, 160);
  plotLinear("A1", 1 * d, 160);
  plotLinear("A2", 2 * d, 160);
  plotLinear("A3", 3 * d, 160);
  plotLinear("A4", 4 * d, 160);
  plotLinear("A5", 5 * d, 160);

  updateTime = millis(); // Next update time
}


void loop() {
  if (updateTime <= millis()) {
    updateTime = millis() + LOOP_PERIOD;

    d += 4; if (d >= 360) d = 0;

    //value[0] = map(analogRead(A0), 0, 1023, 0, 100); // Test with value form Analogue 0

    // Create a Sine wave for testing
    value[0] = 50 + 50 * sin((d + 0) * 0.0174532925);
    value[1] = 50 + 50 * sin((d + 60) * 0.0174532925);
    value[2] = 50 + 50 * sin((d + 120) * 0.0174532925);
    value[3] = 50 + 50 * sin((d + 180) * 0.0174532925);
    value[4] = 50 + 50 * sin((d + 240) * 0.0174532925);
    value[5] = 50 + 50 * sin((d + 300) * 0.0174532925);

    //unsigned long t = millis();

    plotPointer();

    plotNeedle(value[0], 0);

    //Serial.println(millis()-t); // Print time taken for meter update
  }
}


// #########################################################################
//  Draw the analogue meter on the screen
// #########################################################################
void analogMeter()
{
  // Meter outline
  tft.fillRect(0, 0, 239, 126, TFT_GREY);
  tft.fillRect(5, 3, 230, 119, TFT_WHITE);

  tft.setTextColor(TFT_BLACK);  // Text colour

  // Draw ticks every 5 degrees from -50 to +50 degrees (100 deg. FSD swing)
  for (int i = -50; i < 51; i += 5) {
    // Long scale tick length
    int tl = 15;

    // Coodinates of tick to draw
    float sx = cos((i - 90) * 0.0174532925);
    float sy = sin((i - 90) * 0.0174532925);
    uint16_t x0 = sx * (100 + tl) + 120;
    uint16_t y0 = sy * (100 + tl) + 140;
    uint16_t x1 = sx * 100 + 120;
    uint16_t y1 = sy * 100 + 140;

    // Coordinates of next tick for zone fill
    float sx2 = cos((i + 5 - 90) * 0.0174532925);
    float sy2 = sin((i + 5 - 90) * 0.0174532925);
    int x2 = sx2 * (100 + tl) + 120;
    int y2 = sy2 * (100 + tl) + 140;
    int x3 = sx2 * 100 + 120;
    int y3 = sy2 * 100 + 140;

    // Yellow zone limits
    //if (i >= -50 && i < 0) {
    //  tft.fillTriangle(x0, y0, x1, y1, x2, y2, TFT_YELLOW);
    //  tft.fillTriangle(x1, y1, x2, y2, x3, y3, TFT_YELLOW);
    //}

    // Green zone limits
    if (i >= 0 && i < 25) {
      tft.fillTriangle(x0, y0, x1, y1, x2, y2, TFT_GREEN);
      tft.fillTriangle(x1, y1, x2, y2, x3, y3, TFT_GREEN);
    }

    // Orange zone limits
    if (i >= 25 && i < 50) {
      tft.fillTriangle(x0, y0, x1, y1, x2, y2, TFT_ORANGE);
      tft.fillTriangle(x1, y1, x2, y2, x3, y3, TFT_ORANGE);
    }

    // Short scale tick length
    if (i % 25 != 0) tl = 8;

    // Recalculate coords incase tick lenght changed
    x0 = sx * (100 + tl) + 120;
    y0 = sy * (100 + tl) + 140;
    x1 = sx * 100 + 120;
    y1 = sy * 100 + 140;

    // Draw tick
    tft.drawLine(x0, y0, x1, y1, TFT_BLACK);

    // Check if labels should be drawn, with position tweaks
    if (i % 25 == 0) {
      // Calculate label positions
      x0 = sx * (100 + tl + 10) + 120;
      y0 = sy * (100 + tl + 10) + 140;
      switch (i / 25) {
        case -2: tft.drawCentreString("0", x0, y0 - 12, 2); break;
        case -1: tft.drawCentreString("25", x0, y0 - 9, 2); break;
        case 0: tft.drawCentreString("50", x0, y0 - 6, 2); break;
        case 1: tft.drawCentreString("75", x0, y0 - 9, 2); break;
        case 2: tft.drawCentreString("100", x0, y0 - 12, 2); break;
      }
    }

    // Now draw the arc of the scale
    sx = cos((i + 5 - 90) * 0.0174532925);
    sy = sin((i + 5 - 90) * 0.0174532925);
    x0 = sx * 100 + 120;
    y0 = sy * 100 + 140;
    // Draw scale arc, don't draw the last part
    if (i < 50) tft.drawLine(x0, y0, x1, y1, TFT_BLACK);
  }

  tft.drawString("%RH", 5 + 230 - 40, 119 - 20, 2); // Units at bottom right
  tft.drawCentreString("%RH", 120, 70, 4); // Comment out to avoid font 4
  tft.drawRect(5, 3, 230, 119, TFT_BLACK); // Draw bezel line

  plotNeedle(0, 0); // Put meter needle at 0
}

// #########################################################################
// Update needle position
// This function is blocking while needle moves, time depends on ms_delay
// 10ms minimises needle flicker if text is drawn within needle sweep area
// Smaller values OK if text not in sweep area, zero for instant movement but
// does not look realistic... (note: 100 increments for full scale deflection)
// #########################################################################
void plotNeedle(int value, byte ms_delay)
{
  tft.setTextColor(TFT_BLACK, TFT_WHITE);
  char buf[8]; dtostrf(value, 4, 0, buf);
  tft.drawRightString(buf, 40, 119 - 20, 2);

  if (value < -10) value = -10; // Limit value to emulate needle end stops
  if (value > 110) value = 110;

  // Move the needle util new value reached
  while (!(value == old_analog)) {
    if (old_analog < value) old_analog++;
    else old_analog--;

    if (ms_delay == 0) old_analog = value; // Update immediately id delay is 0

    float sdeg = map(old_analog, -10, 110, -150, -30); // Map value to angle
    // Calcualte tip of needle coords
    float sx = cos(sdeg * 0.0174532925);
    float sy = sin(sdeg * 0.0174532925);

    // Calculate x delta of needle start (does not start at pivot point)
    float tx = tan((sdeg + 90) * 0.0174532925);

    // Erase old needle image
    tft.drawLine(120 + 20 * ltx - 1, 140 - 20, osx - 1, osy, TFT_WHITE);
    tft.drawLine(120 + 20 * ltx, 140 - 20, osx, osy, TFT_WHITE);
    tft.drawLine(120 + 20 * ltx + 1, 140 - 20, osx + 1, osy, TFT_WHITE);

    // Re-plot text under needle
    tft.setTextColor(TFT_BLACK);
    tft.drawCentreString("%RH", 120, 70, 4); // // Comment out to avoid font 4

    // Store new needle end coords for next erase
    ltx = tx;
    osx = sx * 98 + 120;
    osy = sy * 98 + 140;

    // Draw the needle in the new postion, magenta makes needle a bit bolder
    // draws 3 lines to thicken needle
    tft.drawLine(120 + 20 * ltx - 1, 140 - 20, osx - 1, osy, TFT_RED);
    tft.drawLine(120 + 20 * ltx, 140 - 20, osx, osy, TFT_MAGENTA);
    tft.drawLine(120 + 20 * ltx + 1, 140 - 20, osx + 1, osy, TFT_RED);

    // Slow needle down slightly as it approaches new postion
    if (abs(old_analog - value) < 10) ms_delay += ms_delay / 5;

    // Wait before next update
    delay(ms_delay);
  }
}

// #########################################################################
//  Draw a linear meter on the screen
// #########################################################################
void plotLinear(char *label, int x, int y)
{
  int w = 36;
  tft.drawRect(x, y, w, 155, TFT_GREY);
  tft.fillRect(x + 2, y + 19, w - 3, 155 - 38, TFT_WHITE);
  tft.setTextColor(TFT_CYAN, TFT_BLACK);
  tft.drawCentreString(label, x + w / 2, y + 2, 2);

  for (int i = 0; i < 110; i += 10)
  {
    tft.drawFastHLine(x + 20, y + 27 + i, 6, TFT_BLACK);
  }

  for (int i = 0; i < 110; i += 50)
  {
    tft.drawFastHLine(x + 20, y + 27 + i, 9, TFT_BLACK);
  }

  tft.fillTriangle(x + 3, y + 127, x + 3 + 16, y + 127, x + 3, y + 127 - 5, TFT_RED);
  tft.fillTriangle(x + 3, y + 127, x + 3 + 16, y + 127, x + 3, y + 127 + 5, TFT_RED);

  tft.drawCentreString("---", x + w / 2, y + 155 - 18, 2);
}

// #########################################################################
//  Adjust 6 linear meter pointer positions
// #########################################################################
void plotPointer(void)
{
  int dy = 187;
  byte pw = 16;

  tft.setTextColor(TFT_GREEN, TFT_BLACK);

  // Move the 6 pointers one pixel towards new value
  for (int i = 0; i < 6; i++)
  {
    char buf[8]; dtostrf(value[i], 4, 0, buf);
    tft.drawRightString(buf, i * 40 + 36 - 5, 187 - 27 + 155 - 18, 2);

    int dx = 3 + 40 * i;
    if (value[i] < 0) value[i] = 0; // Limit value to emulate needle end stops
    if (value[i] > 100) value[i] = 100;

    while (!(value[i] == old_value[i])) {
      dy = 187 + 100 - old_value[i];
      if (old_value[i] > value[i])
      {
        tft.drawLine(dx, dy - 5, dx + pw, dy, TFT_WHITE);
        old_value[i]--;
        tft.drawLine(dx, dy + 6, dx + pw, dy + 1, TFT_RED);
      }
      else
      {
        tft.drawLine(dx, dy + 5, dx + pw, dy, TFT_WHITE);
        old_value[i]++;
        tft.drawLine(dx, dy - 6, dx + pw, dy - 1, TFT_RED);
      }
    }
  }
}
This code is for testing the display and shows various graphical shapes and designs.

Comments (3)
Dear Sir,
How to send the variable float data to the display.
Please send some example reference code.
otherwise your all code is working fine. I have tested at my end.
Thanks for your help.
Hi Sanket,
Thank you for sharing.
To display any type of value, you can refer to an example within the same library. At the end of the example, you’ll find instructions on how to display floating-point numbers.
Hello Sir,
I tried with this code also ut it is showing Invalid liabrary found.